Wilmington’s residents still think their city is a good place to visit. They’re less enthusiastic about it as a place to live, and considerably less enthusiastic about it as a place to raise children. Across nine community surveys from 2007 through 2025, those judgments have grown further apart, even as the city has built projects and funded programs intended to address residents’ concerns.
The latest survey puts affordable housing near the top of the public agenda, alongside a traffic problem that residents were already flagging in 2007. Participation also receives a weak rating. Only 16% of respondents with an opinion were satisfied with public involvement in city decisions in 2025.
These are city residents’ assessments, including their opinions about visitor appeal. They aren’t surveys of tourists, and they don’t establish that tourism caused the problems. Read together, the reports show what people continue to appreciate and what makes daily life harder. The city’s published records help establish how it has responded.
Visitor appeal has held up better than living and family ratings
In the 2012 community survey, 89% of respondents with an opinion rated Wilmington as an excellent or good place to visit. Almost the same share, 88%, gave it that rating as a place to live. For raising children, the figure was 80%.
By 2025, visitor appeal was still 86%, while the rating for living here was 69% and the rating for raising children was 51%. The difference between visiting and living had grown from about one percentage point to 17. The difference between visiting and raising children had grown from nine points to 35.
Visitor appeal stayed high as living and family ratings weakened
Shared scale: 0 to 100%
The intervening years matter. Ratings as a place to live were 84% in 2015, 83% in 2017 and 2019, about 80% in 2021, and 74% in 2023. The change wasn’t confined to the last survey, although the more recent declines are especially visible.
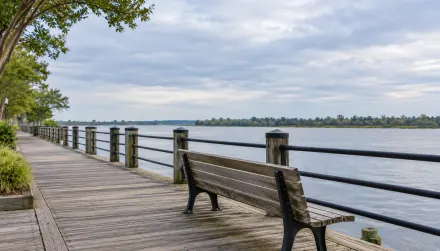
The distinction makes sense in everyday terms. A visit can include an afternoon on the Wilmington Riverwalk and a meal downtown. Living here also means finding housing you can afford, getting to work, and deciding whether the city meets your family’s needs. The surveys measure people’s assessments of those different purposes; they don’t tell us which specific experience caused a respondent’s answer.
Nor do the results describe a city where everything has stopped working. In 2025, about 85% were satisfied with fire services, 78% with residential trash collection, and 73% with the maintenance and appearance of existing city parks. Those are substantial strengths. Parks such as Greenfield Lake serve people who live here as well as people passing through.
The more useful question is why those strengths coexist with weaker confidence in living and raising children here.
Housing has become a more urgent concern
Affordable housing wasn’t a newly discovered problem in 2025. The 2007 survey already asked about its availability, and only 22% of respondents with an opinion were satisfied. That figure improved to 32% in 2010 and 35% in 2012, then fell to 31% in 2015, 29% in 2017 and 18% in 2019.
The recent surveys also ask respondents to select the three most important challenges facing people living in Wilmington. Affordable housing appeared in 21% of respondents’ top three in 2021, 36% in 2023 and 42% in 2025.
Affordable housing appears more often among residents’ top three challenges
Top-three challenge selections (%) · equally spaced periods · baseline 0
View data table
| Survey year | Top-three challenge selections (%) |
|---|---|
| 2021 | 21% |
| 2023 | 36% |
| 2025 | 42% |
That is an increase of 21 percentage points across the three waves. The questionnaire’s options and their order changed, so the increase can’t be attributed entirely to changing opinions. Nevertheless, housing features much more prominently in the recorded responses than it did in 2021.
The 2025 satisfaction question reinforces the concern. Only about 16% of respondents with an opinion were satisfied with affordable-housing availability, while about 67% were dissatisfied. Satisfaction and priority measure different things, but both show an issue that deserves attention.
There is a further distinction buried in the tables. Traffic was the most widely selected challenge when all three choices were counted, at 51%. But housing was the challenge respondents most often placed first: 30.4% ranked it first, compared with 20.5% for traffic.
Housing became the most frequently ranked first challenge in 2025
Shared scale: 0 to 100%
In 2023, growth and development was the most frequently ranked first challenge, at 35.2%. Housing’s first-choice share was 13.4%. By 2025, housing’s first-choice share exceeded both growth and traffic. Housing also moved from seventh to first in the questionnaire’s list of choices, an important reason to be cautious about treating the size of that increase as a precise change in concern.
Even with that qualification, the distinction is useful. A widely shared frustration with traffic and an often first-ranked concern about housing can coexist. Addressing congestion doesn’t substitute for making it possible to afford a home here.
Traffic frustration predates the latest growth debate
In 2007, 61% of respondents selected traffic management among the three services that should receive the most emphasis. Only 19% were satisfied with it. The distinction matters because a sentence in the original executive summary repeats the 61% figure while discussing satisfaction; the report’s chart and importance-satisfaction table establish the 19% satisfaction figure.
Traffic satisfaction improved in the next two surveys, reaching 30% in 2010 and 32% in 2012. Those early gains didn’t hold. By 2019 it was 18%, and it was again about 18% in 2025.
Traffic satisfaction improved early, then returned near its original low
Satisfied or very satisfied (%) · years spaced proportionally · scale 0 to 40%
View data table
| Survey year | Satisfied or very satisfied (%) |
|---|---|
| 2007 | 19% |
| 2010 | 30% |
| 2012 | 32% |
| 2015 | 29% |
| 2017 | 23% |
| 2019 | 18% |
| 2021 | 22% |
| 2023 | 17% |
| 2025 | 18% |
The full sequence prevents two misleading stories. Traffic satisfaction hasn’t fallen in every survey, and the problem didn’t begin after 2020. There were gains, reversals and a partial recovery in 2021, followed by ratings close to the original low baseline.
The reports also identify traffic and street maintenance as recurring opportunities for improvement. Their importance-satisfaction analysis combines how important people consider a service with how satisfied they are with it. Traffic and streets/sidewalks repeatedly rank near the top because they matter to residents and receive weak ratings.
But the questions used to rank priorities changed. In 2007, respondents were asked which services should receive emphasis; later surveys asked which services were most important to provide. Police and fire can be highly important even when residents are satisfied with them. We shouldn’t read every change in the priority ranking as a change in the public’s underlying wishes.
The city has responded, but action and satisfaction are different measures
Wilmington’s public records provide examples of officials connecting survey findings to spending. The city’s Summer 2017 newsletter said the newly approved budget funded priorities identified in that year’s survey. It described a five-year, $59 million infrastructure plan, transportation-bond funding, and additional funding for affordable housing and public safety.
This is the city’s own explanation of the budget. It documents an acknowledgment and a stated response, although it doesn’t isolate how a specific survey answer changed a particular appropriation. The transportation and parks bonds also predated the 2017 survey, so that survey couldn’t have originated them.
An earlier 2016 parks-bond report cited the latest citizen survey and comprehensive plan in explaining residents’ desire for more recreation opportunities. The proposed bond was $30.4 million. Those records make a blanket claim that the surveys are ignored difficult to support.
From stated priorities to documented actions
- 2016: parks-bond proposal
The city cited survey and comprehensive-plan requests for recreation opportunities when explaining its proposed $30.4 million parks bond.
- 2017: budget response
The city connected its new budget to survey priorities, including a five-year $59 million infrastructure plan and additional housing and public-safety funding.
- 2018: completed neighborhood access
The city reported the $5 million Love Grove Memorial Bridge complete, providing another entrance where rail traffic could block the previous sole access.
- FY24: reported housing-program outputs
The city reported 18 housing-program loans, 240 homebuyer-education participants and 10 home-hazard interventions. These are separate outputs, not a count of new homes.
- 2025: use of the latest survey
Staff listed strategic planning, departmental business plans and individual work plans as uses of the survey data. That is a stated process, not proof of completed outcomes.
Some responses produced tangible changes. The city reported in Spring 2018 that the $5 million Love Grove Memorial Bridge was complete. It provided another entrance to a neighborhood whose sole entrance on 11th Street could be blocked by trains. That is a specific access benefit, even if it wouldn’t make a trip across the whole city feel less congested.
Trail investments also connect recreation with daily travel. The city’s Greenville Loop Trail page records the south section’s completion in 2023 and a completed College Road crossing linking it to Central College Trail. The larger trail is a phased project. Its published page includes old anticipated start dates, so those dates don’t establish that every section is open today.
Housing has a documented response, too. The city and county established a Workforce Housing Advisory Committee in 2016. The city’s Fall 2024 housing report described 18 loans closed through homebuyer and rehabilitation programs, 240 people attending homebuyer education, and 10 home-hazard interventions during the July 2023-June 2024 reporting period.
Those are different kinds of help. They shouldn’t be added together and presented as a count of newly built affordable homes. They establish activity and reported outputs, while the survey measures residents’ broader experience of housing availability. The published figures alone don’t establish whether those efforts are large enough to meet citywide need.
The 2025 staff survey presentation lists strategic planning, departmental business plans and individual work plans as uses of the data. The FY26 adopted budget identifies housing affordability, public engagement and transportation improvements as objectives. That shows alignment with public concerns, but listing an objective isn’t the same as delivering an outcome.
The evidence supports a qualified answer: Wilmington has acknowledged priorities and acted on them, while residents continue to report serious unresolved concerns. To evaluate the response, look separately for a funded decision, completed work, its scale, and a relevant result. A completed bridge has an access outcome; an affordable-housing program needs a housing outcome. Neither is fully assessed by an overall satisfaction headline.
Being helped by staff and feeling heard are different experiences
In 2025, 52% of respondents said they had contacted the city during the previous year. Among those contacts who had an opinion, 72% were satisfied with how they were treated and 70% with how easy employees were to contact.
Satisfaction with public involvement in city decisions was much lower, at 16%. It was about 22% in 2021 and 15% in 2023. Earlier, it reached about 29% in 2015. None of those figures suggests a consistently strong sense of participation.
Satisfaction with public involvement remains low
Satisfied or very satisfied (%) · equally spaced periods · baseline 0
View data table
| Survey year | Satisfied or very satisfied (%) |
|---|---|
| 2021 | 21.5% |
| 2023 | 14.7% |
| 2025 | 16% |
The measures involve different groups and questions. They don’t prove that the same people who received helpful service felt excluded from decisions. Handling a request well and giving residents meaningful involvement in decisions that shape the city are different responsibilities. Both matter.
The broader communication results also resist a simple good-news headline. Satisfaction with efforts to keep residents informed rose from 34% in 2023 to 43% in 2025, while satisfaction with overall communication effectiveness fell from about 43% to 28%. The 2025 question added examples to the broader communication item, so that wording difference belongs alongside the comparison. Providing more information and making communication useful aren’t necessarily the same achievement.
Low involvement satisfaction doesn’t prove officials disregard residents. It does make residents’ experience of participation an outcome worth tracking alongside project completions and service delivery.
How to read the nine surveys without overstating the changes
ETC Institute surveyed a random sample of city households in each wave. Completed samples ranged from 625 to 866 households, and the reports state margins of error of approximately 3.3 to 3.9 percentage points at 95% confidence. Each wave surveyed a separate sample of households, so the results describe citywide views rather than tracking individual residents over 18 years. Citywide results also don’t establish the opinions of renters, parents or individual neighborhoods.
The table below keeps the full historical sequence visible. Ratings combine the top two positive responses and exclude “don’t know.” Values are rounded, so small differences shouldn’t carry the argument.
| Survey | Excellent/good place to visit | Excellent/good place to live | Excellent/good place to raise children |
|---|---|---|---|
| 2007 | 88% | 84% | 71% |
| 2010 | 88% | 85% | 77% |
| 2012 | 89% | 88% | 80% |
| 2015 | 88% | 84% | 73% |
| 2017 | 89% | 83% | 71% |
| 2019 | 88% | 83% | 69% |
| 2021 | 89% | 80% | 69% |
| 2023 | 86% | 74% | 58% |
| 2025 | 86% | 69% | 51% |
The positive labels for these place ratings remain excellent/good, although the middle response changed from average to neutral in 2025 and question placement changed. Several other 2025 questions have a larger change in their response scale, using excellent/good where earlier surveys used satisfied/very satisfied. That includes the overall quality-of-life question. Its reported 20.9-point increase shouldn’t be read as a clean improvement on an unchanged measure.
Priority choices changed as well, including the list and order of possible challenges. Older affordable-housing satisfaction questions weren’t included in the 2021 and 2023 reports; those missing observations aren’t zeroes. Survey response methods evolved from mail and telephone to mail and online, with email or text follow-up in later waves. A report’s use of one wave’s margin of error to flag a change also isn’t a full statistical test between two independent waves.
The strongest story therefore rests on large, repeated patterns, supported by the underlying questions. Wilmington retains considerable visitor appeal. Living and family ratings have weakened from their early-2010s highs. Housing features more prominently in recent challenge selections, and traffic remains a long-running frustration.
What residents can watch next
The city describes its community survey as biennial, which makes 2027 the expected next survey year after 2025. As of October 12, 2026, the official survey archive doesn’t announce a 2027 fieldwork date or participation window. In 2025, ETC Institute mailed invitations to a random sample of city households, with a paper return envelope and an online response option. If your household receives the next invitation, follow its instructions to respond by mail or online; the next wave’s arrangements still need to be announced.
There is also a separate opportunity to give housing feedback now. The city’s Five-Year Consolidated Plan page currently links an online survey for its fiscal 2028-2032 housing and community-development plan. That input process is separate from the representative citywide community survey examined here. Check the city’s page for current availability.
The city’s survey archive is useful beyond the headline summary. Keep the specific question, its response scale and its denominator beside a number when comparing surveys. Then use the city’s project pages and budget records to follow what happened between surveys.
For transportation, look for completed connections and evidence that they improve access or travel, with city, state and regional responsibilities identified. For housing, look for homes created or preserved, who can afford them, and how long their affordability lasts. For public involvement, follow whether the city shows how input affected a decision, as well as how many opportunities it offered to comment.
Wilmington’s surveys document things residents value and problems they have raised repeatedly. The city has delivered improvements, and its own records connect some spending to those priorities. The remaining question is whether the scale and pace of that response can make living here feel as promising as visiting still does.